Team Members:
Tanner Honnef and Jens Peterson
Affiliation:
GEOG 313: Advanced Geospatial Analytics in Python
Project Description:
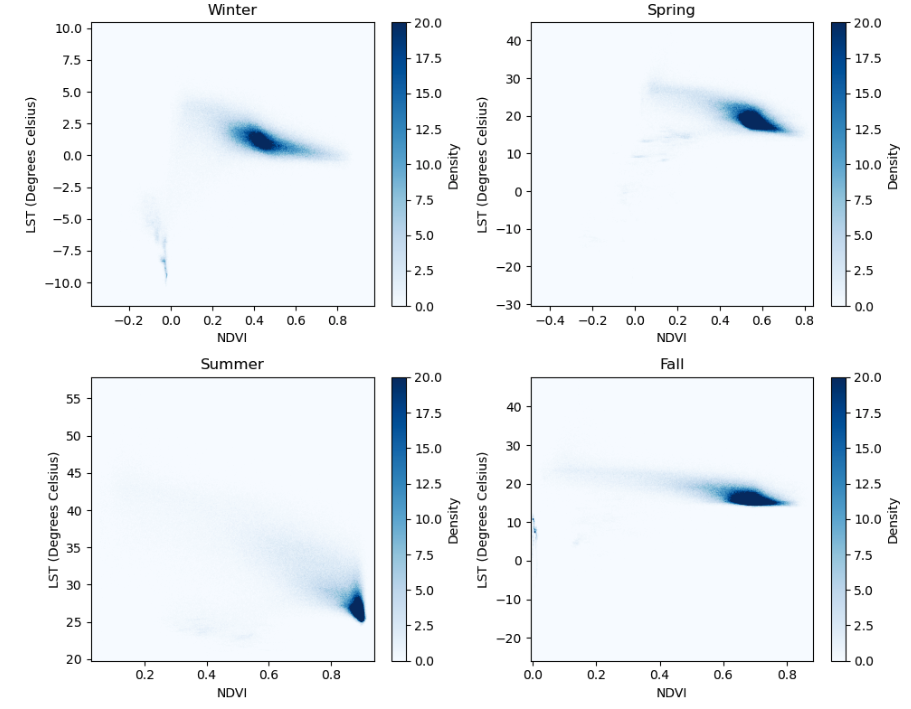
This project is a visualization of NDVI for a place that a user defines. This example uses Worcester, Massachusetts as the study area. With this script, a user can generate density plots of NDVI in a given bounding box within dates set by the user.